The Leaseurope Index is a unique survey that tracks key performance indicators of a sample of 23 European lessors on a quarterly basis. This fourth quarter of 2016 survey is thetwenty-fourthedition.
ŷ������(Leaseurope)ָ����һ����23��ŷ������˾Ϊ����������ÿ���ȹؼ�ҵ��ָ���Ȩ�����н����������2016����ļ���(�³�"2016Q4")�ĵ��б����ѡ����ݱ�����ŷ������ָ��ϵ�е��б���ĵ�24�档
The weighted average ratios for Q4 2016 weakened considerably compared to the same quarter of 2015. This was largely a result of extreme values in a small part of the sample and therefore does not reflect general market trends. When looking at the medians, the performance of the ��typical�� leasing company improved across all indicators in Q4 2016 compared to the same period of 2015. On an annual basis, most ratios also improved in 2016, with the exception of a stable RoA and declining RoE. Due to the large variation in results by company in Q4 2016, with some exceptional outliers, the median figures represent a more consistent estimate of market trends than the weighted average ratios.
2016Q4�ļ�Ȩƽ���������2015Q4��һ�����ȵ��½�������Ҫ��������С���ּ�ֵӰ�죬�����ܷ�ӳ�����г����ơ�����λ����������2015Q��ȣ�������˾2016Q4��ҵ��ָ�궼�������ơ�������������������ʲ�������(RoA)ά���ȶ��;��ʲ�������(RoE)�����½����⣬2016���������ݶ��������ơ�����2016Q4����˾ҵ�����ܴ��ҳ�����һЩ������쳣ֵ�������λ���ȼ�Ȩƽ�������ܸ���ȷ�ķ�ӳ�г����ơ�
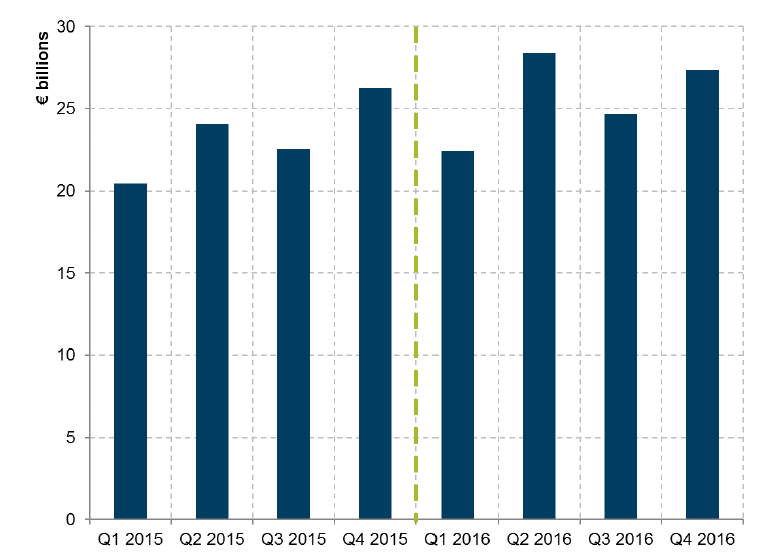
Total new leasing volumes reported by the sample of firms increased by 4.3% in comparison to the same quarter a year ago, growing to over �27 billion, while the whole of 2016 saw double digit growth of 10.3% compared to 2015. The portfolio of outstanding contracts in the sample grew by 2.5% in 2016 while risk-weighted assets remained relatively stable (0.6%).
������˾��������ҵ���ܶ�ͬ��������4.3%���ﵽ��270��ŷԪ���ϡ�2016��ȫ������ҵ���ܶ�ͬ��������10.3%���ڷ��ռ�Ȩ�ʲ���������ȶ���0.6%������£�2016��������˾��δ�����ͬ�ܶ�������2.5%��
�����ӯ������
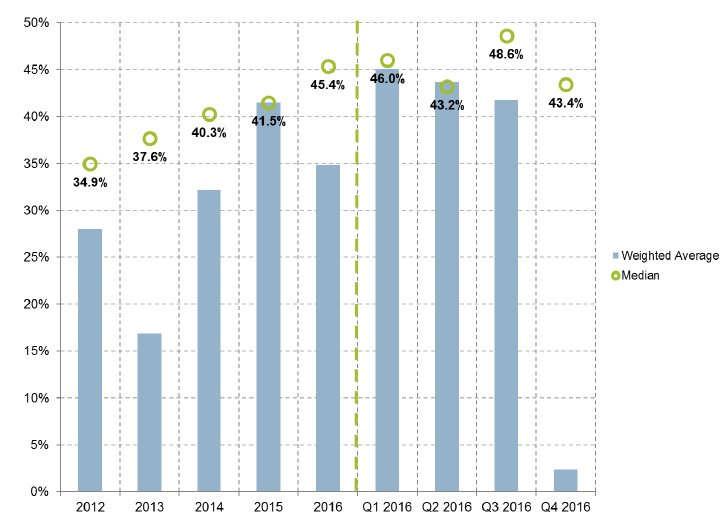
In Q4 2016 large loan loss provisions in an isolated portion of the sample heavily influenced aggregate profit not just for the quarter but for the full year 2016 as well. Despite this, the median profitability ratio increased to 43.4% in Q4 2016, rising by over four percentage points on the comparable figure of Q4 2015 (39.0%). The profitability ratio in 2016 experienced a similar rise to 45.4% compared to 41.5% in 2015. As we can see from the figure, median leasing profitability figures have been consistently on the rise for the last four years.
��2016Q4��������ҵ��һ������ҵ�Ĵ���������ʧ��������Ӱ���˱����Ⱥ�2016��ȫ�����ҵ����������ˣ�2016Q4��ӯ����������(profitability ratio)��λ��������43.4%��ͬ��������4���ٷֵ㡣2016ȫ���ӯ���������ʳ���С�����ǣ���ȥ��ͬ�ڵ�41.5%������45.4%��ͼ�п��Կ�������ȥ����������ҵӯ������������λ��һֱ��������
���룬֧���ͳɱ������
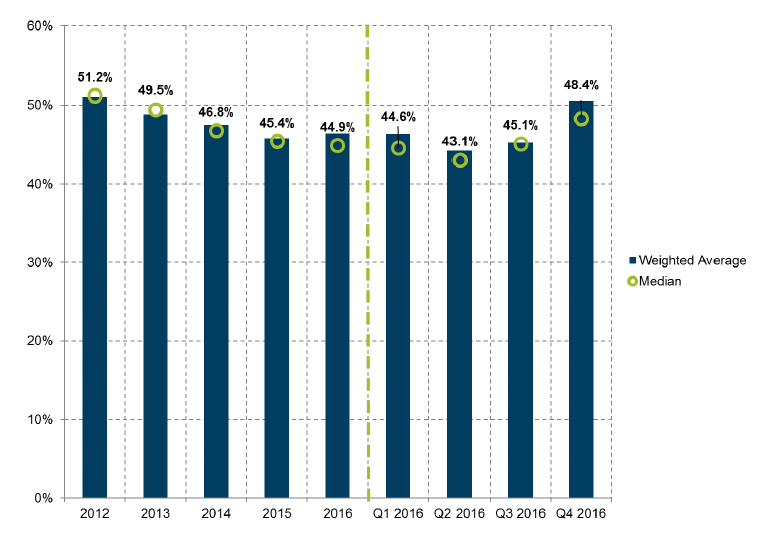
Average operating income continued its consistent growth in Q4 2016 compared to the same period a year ago, increasing by 2.2%. Average operating expenses during that period increased by a much larger amount of 7.2%. However, when looking at the median values as opposed to the weighted average, the cost/income ratio actually fell from 49.8% in the fourth quarter of 2015 to 48.4% in Q4 2016. For 2016 overall, the median cost income ratio fell by half a percentage point to 44.9% from 45.4% in 2015.
������ҵƽ��Ӫҵ������2016Q4������������������Ϊ2.2%�� ���ڼ��ƽ��Ӫҵ����������˸�������ӣ�������7.2%��Ȼ��������λ��ֵ�����Ǽ�Ȩƽ�����������ɱ��������(cost/income ratio)ʵ���ϴ�2015����ļ��ȵ�49.8%�½�����2016Q4��48.4%��2016��ȫ�꣬�ɱ�������ʵ���λ����2015���45.4%�½��˰���ٷֵ���44.9%��
������ʧ����ͷ��ճɱ�
While loan loss provisions increased markedly in Q4 2016 compared to Q4 2015 (by 116%), as mentioned before this was due to some extreme outlier values. When looking at the median cost of risk ratio, the typical leasing company experienced an improvement in Q4 2016 and 2016 overall. Both Q4 2016 and total 2016 figures fell from 0.3% in the previous period to 0.2%.
��Ȼ2016Q4�Ĵ�����ʧ����ͬ�����Ÿߴ�116%������������������Ҫ��ijЩ���˵��쳣ֵ������ġ� �ο����ճɱ�����(cost of risk ratio)����λ�����ǿ��Է��֣���Ҫ����˾2016Q4��2016ȫ������ݾ�ͬ���������ƣ�2016Q4��2016��ȫ�����ݾ�����ǰ��0.3%�½���0.2%��
�ʲ�������(RoA)�;��ʲ�������(RoE)ָ��
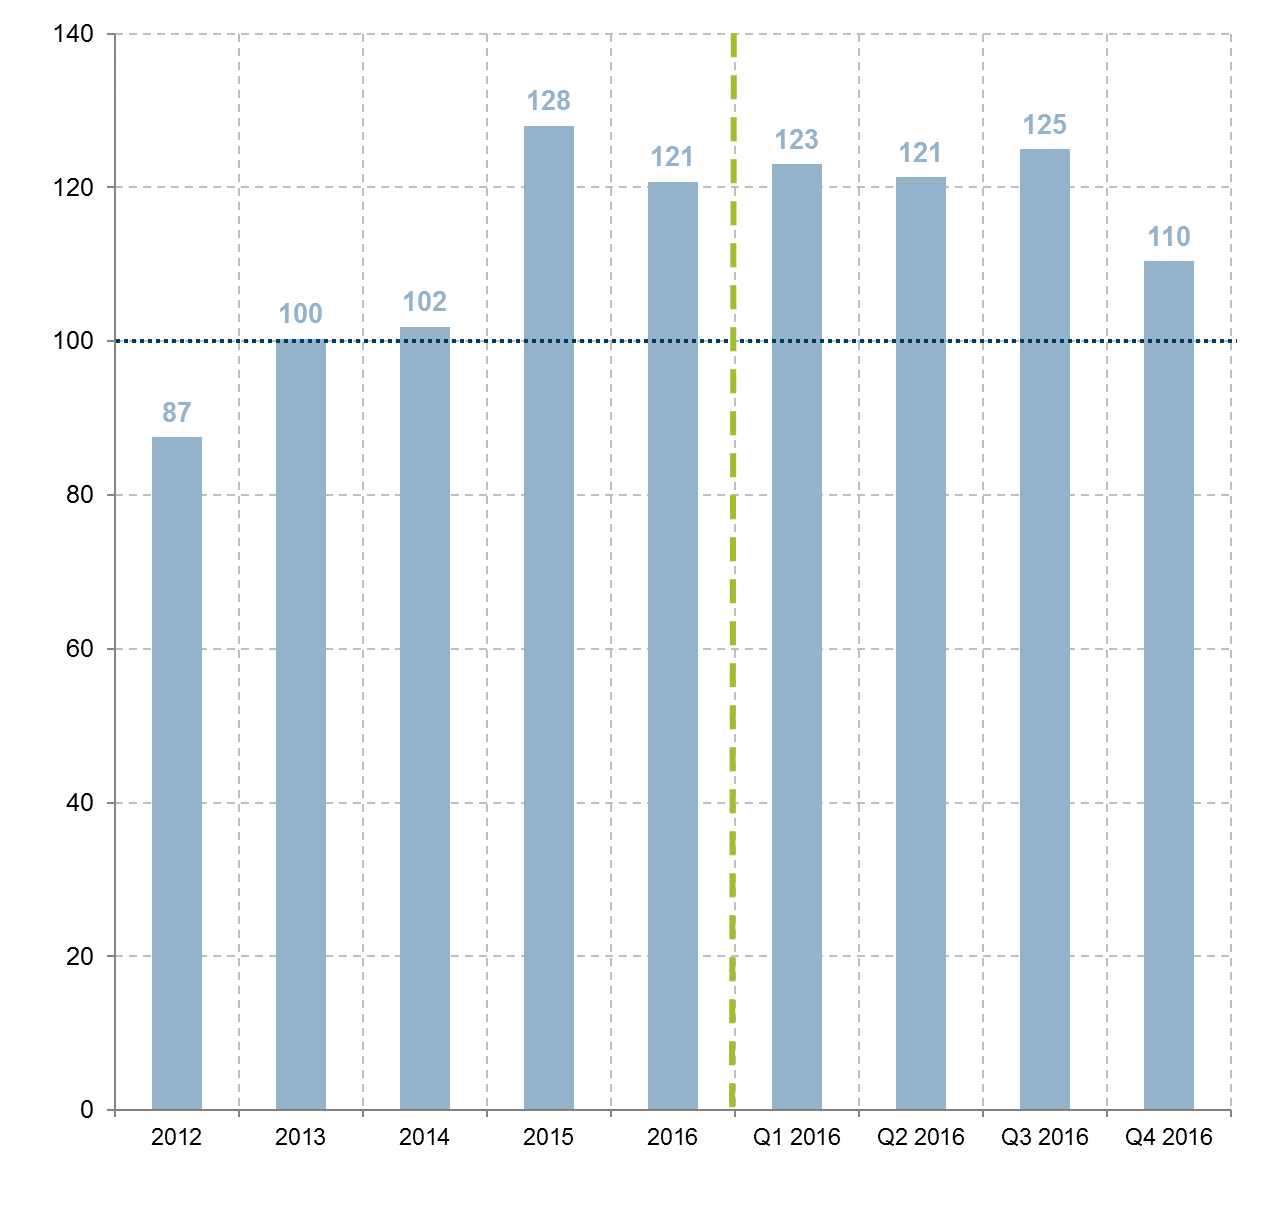
Median RoA and RoE 1 figures grew in Q4 2016 compared to Q4 2015, reaching 1.6% and an index value of 110, respectively. Over the full year, RoA remained stable at 2.1% in 2016 and RoE fell slightly to 121 (compared to 128 in 2015).
2016Q4 RoA��RoE��λ����ͬ���������ӡ�RoA��λ���ﵽ��1.6%��RoE��λ��Ϊ110��2016��ȫ�꣬RoA ��λ���ȶ�����2.1%��RoE��λ��Ϊ 121�����2015���128�����½���
Marie-Christine Ducholet, CEO of Soci��t�� G��n��rale Equipment Finance, commented that, ��While the second half of 2016 was more challenging for European leasing companies than the first, our industry finished the year in a solid position. For the most part, European lessors recorded encouraging growth in both new business volumes and in their portfolios. There was also a notably resilient performance in profitability and return on equity for the typical leasing company, despite increased competition and a squeeze on margins. Our industry goes into 2017 facing a generally favourable economic climate. As the European Commission has pointed out in its Winter Economic Forecast, all EU economies are forecast to grow in 20172. In addition, our industry can benefit from an expected pickup in activity in the real economy resulting from the Investment Plan for Europe as well as continued low financing costs. European lessors weathered the storm well in 2016, we are confident 2017 will bring more opportunities for development.��
������ҵ�豸���ʹ�˾��ϯִ�йٵ�����(Marie-Christine Ducholet)���۵��������ܶ�ŷ������˾��˵2016���°�����ϰ����Ϊ���ѣ������ǵ���ҵ�ڽ������ɱ��ּ�ͦ���ڴ��������£�ŷ������˾����ҵ�����Ͳ�Ʒ���������ֳ�������ܵ���������Ȼ���پ����Ӿ硢�������»��IJ������棬������˾��ӯ���������ʱ��ر������������������ǵ���ҵ��2017�꽫������ȫ����Ƶľ��û���������ŷ��ίԱ�����䡰��������Ԥ�⡱��ָ����������Ԥ������ŷ�˾����彫�������������⣬���ǵ���ҵ���Դ�ŷ��Ͷ�ʼƻ���ʵ�徭�ô���������ͳ����ĵ����ʳɱ������档ŷ������˾��2016�꾭��ס�˱�����Ŀ��飬����������2017��ӭ������ķ�չ������
����Ϊ�������ͼ����
2016�꼾������

�������(2012��2016)

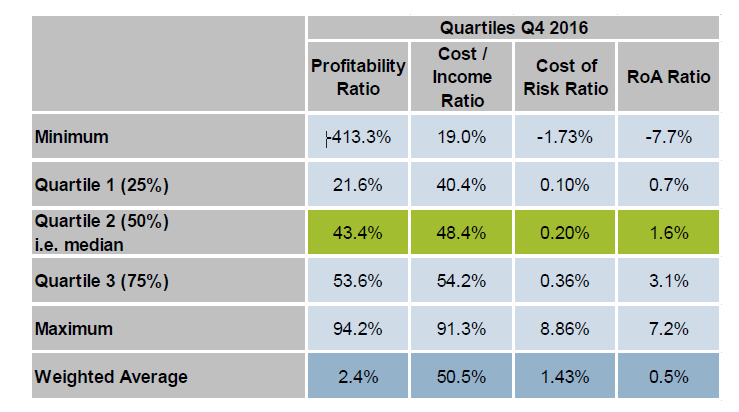
2016��ؼ�ָ����λ��

2015��ؼ�ָ����λ��

����ָ��������(2015~2016)

����ҵ����(2015Q1~2016Q4)
ӯ����������(2012~2016)
�ɱ��������(2012��2016)
���ճɱ�����(2012~2016)

�ʲ��ر���(2012~2016)

���ʲ��ر���(2012~2016)
2016����ļ��ȹؼ�ָ����ķ�λ��

 �������� |
������ |
��ϵ���� |
�������� |
�������� |
����֧��
�������� |
�������� |
������ |
��ϵ���� |
�������� |
�������� |
����֧��